Introduction
Abstract
Spatial transcriptomics revolutionizes transcriptomics by incorporating positional information. However, an emergency problem is to find out the gene expression pattern which can reveal the special region in tissue and find out the genes only expression in those regions.
Comparison of spot- and gene-based strategies for processing ST data.

Overview of STMiner
STMiner processes ST data by leveraging the spatial distribution of genes, mitigating biases otherwise introduced by uneven cell density distribution, low sampling rates, and the complex spatial structures of tumor tissues. Key differences between spot- and gene-based strategies are illustrated on the left and right of the figure, respectively.
(Top) Genes whose spatial structure is similar to background are typically misidentified as marker genes by spot-based methods, resulting in false positives. STMiner effectively removes this noise by comparing gene distributions with the background distribution.
(Middle) Spot-based strategies use the expression levels of genes within a spot as features for classification. However, lowly expressed genes are often filtered out due to their low frequency and weak signals, resulting in gaps in the final expression profile. In contrast, STMiner quantifies the distinctiveness of each gene’s expression pattern compared to the overall tissue distribution, irrespective of expression level.
(Bottom) Spot-based methods assign a label to each spot, so that overlapping regions may be mistakenly classified as belonging to separate clusters. In contrast, STMiner incorporates an unsupervised clustering step for its set of SVGs, allowing it to determine the spatial structures of each cluster, which may overlap.
Algorithm Detail
Here we propose “STMiner” based on the Gaussian mixture model to solve this problem. STMiner is a bottom-up methodology algorithm. It is initiated by fitting a parametric model of gene spatial distributions and constructing a distance array between them utilizing the optimal transport and Hellinger distance. Genes are clustered, thereby recognizing spatial co-expression patterns across distinct gene classes.
STMiner is implemented as an open-source Python package and is available for use at STMiner.

Overview of STMiner
The spatial distribution of gene expression 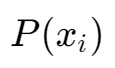 was characterized using Gaussian Mixture Modeling (GMM), and a distance array was constructed by computing the Hellinger distance following the optimal matching of each GMM component. Each gene distribution within the distance array was projected into a lower-dimensional space and assigned distinct features.
Subsequently, genes were clustered based on their distribution features, and the expression pattern of each cluster was calculated.
Additionally, cross-modal data can also map to each other by STMiner under the mixture model.
Fit the Guassian Mixture Model

GMM

Fit GMM
Find SVG
STMiner estimates the spatial variation level (SVL) by calculating the optimal transmission distance from gene spatial distribution to overall spatial distribution to identify the spatial variable genes.
Find SVG by Optimal Transmission
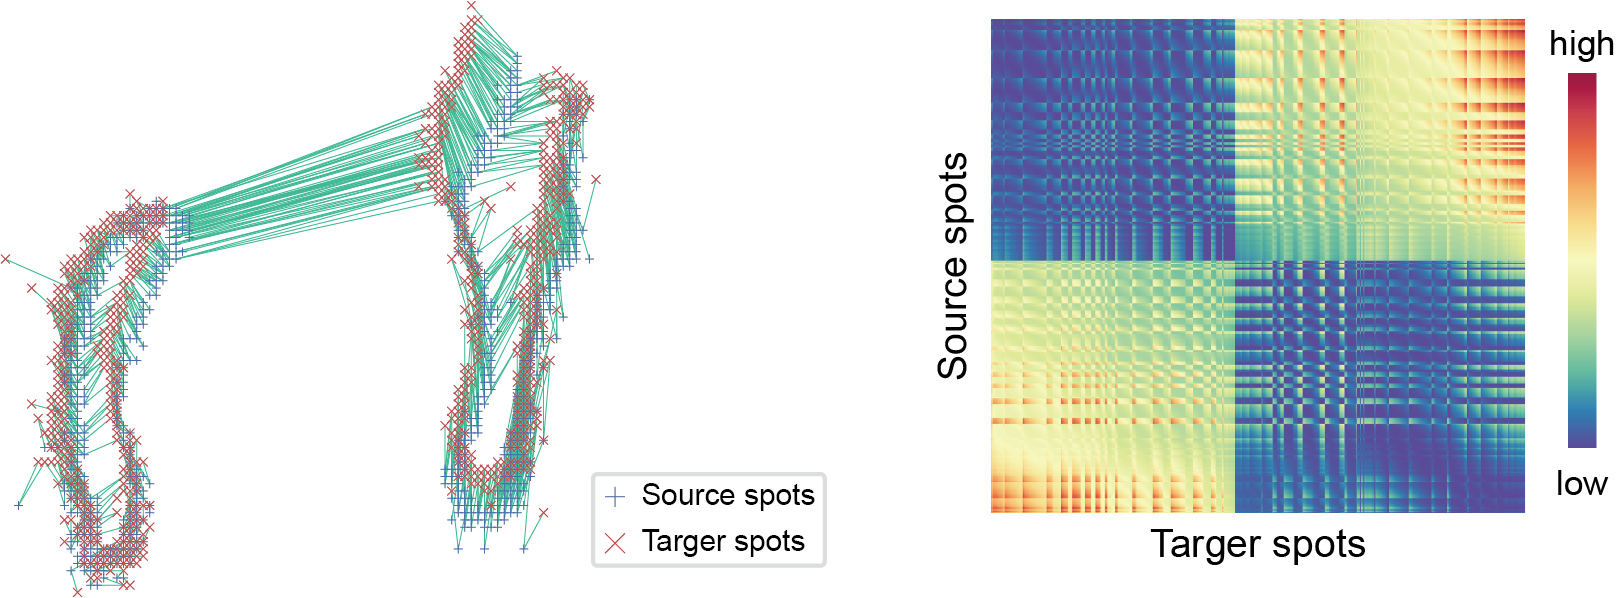
Transport distance between GMMs
Find SVG by Optimal Transmission
The value of each small box in the green matrix can be calculated by the following formula:

Hellinger Distance between two GMM components
Referance:
Pardo, L. (2018). Statistical Inference Based on Divergence Measures
Wikipedia: Hellinger distance
Multidimensional scaling & Cluster the genes
After the distance array was generated, STMiner find out the low dimensions embedding of distance array by Multidimensional Scaling.
Multidimensional scaling (MDS) is a means of visualizing the level of similarity of individual cases of a dataset. MDS is used to translate “information about the pairwise ‘distances’ among a set of n objects or individuals” into a configuration of n points mapped into an abstract Cartesian space.
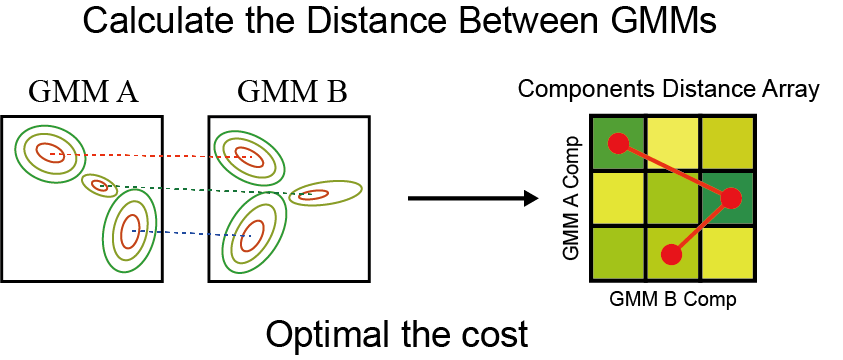
Here’s an example that embedding 3D data into 2D use MDS:
High Dimension Data
2D embedding after MDS
More technically, MDS refers to a set of related ordination techniques used in information visualization, in particular to display the information contained in a distance matrix. It is a form of non-linear dimensionality reduction.
Finally, K-Means was employed to conduct clustering on the genes from the embedding space.
Referance:
Borg, I.; Groenen P. Springer Series in Statistics (1997) Modern Multidimensional Scaling - Theory and Applications
Kruskal, J. Psychometrika, 29 (1964) Nonmetric multidimensional scaling: a numerical method
Kruskal, J. Psychometrika, 29, (1964) Multidimensional scaling by optimizing goodness of fit to a nonmetric hypothesis
Wikipedia: Multidimensional scaling